Designing Rigorous Ablation Studies and SOTA Benchmarking for AI Research: How to Satisfy IEEE Transactions and Springer Reviewers
A comprehensive guide for doctoral researchers and AI scholars on constructing defensible ablation studies, avoiding strawman baseline traps, enforcing multi-seed variance protocols, and passing strict IEEE Transactions and Springer peer reviews.
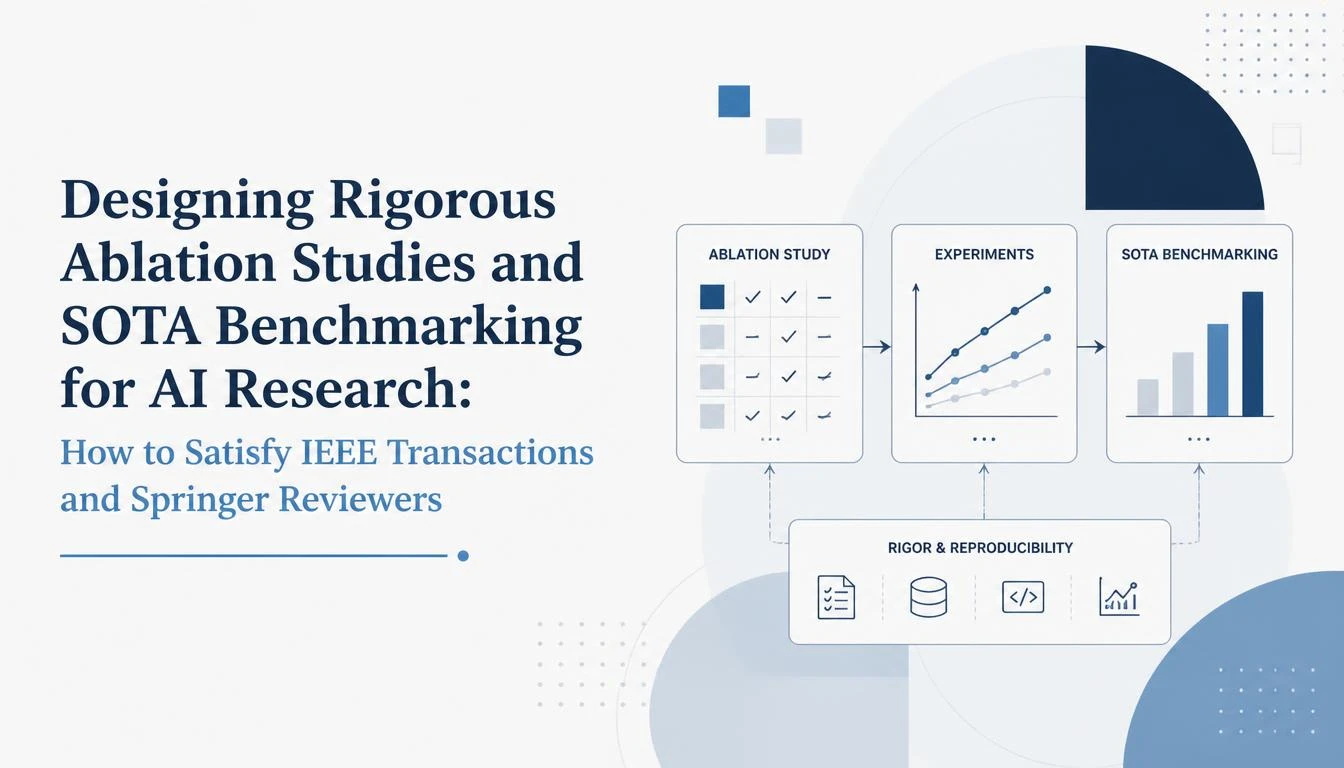
“The single most common ground for peer-review rejection across flagship IEEE and Springer AI journals is not mathematical inadequacy or lack of ambition—it is the absence of rigorous causal attribution. When a manuscript reports state-of-the-art metrics, reviewers immediately scrutinize whether the improvement stems from genuine architectural innovation or merely reflects hyperparameter tuning and random seed variance. This definitive guide delivers the complete blueprint for designing publication-grade ablation studies, curating contemporary SOTA baselines, executing non-parametric statistical significance testing, and authoring bulletproof responses to Reviewer #2.”
1. The Anatomy of IEEE & Springer Reviewer Rejections: Why 68% of AI Papers Collapse at Methodology
Across flagship artificial intelligence and computational engineering journals—including IEEE Transactions on Pattern Analysis and Machine Intelligence (TPAMI), IEEE Transactions on Neural Networks and Learning Systems (TNNLS), IEEE Transactions on Image Processing (TIP), and Springer Nature's Machine Learning—a profound paradigm shift has unfolded over the past three years. The era when a doctoral scholar could simply string together a convolutional backbone, a self-attention module, and a standard cross-entropy loss to report a 1.5% accuracy gain over baseline models and expect acceptance is officially extinct.
Today, editorial boards and peer reviewers operate under strict methodological mandates designed to combat the 'reproducibility crisis' and the proliferation of architectural alchemy. The single most frequent ground for rejection cited by Reviewer #2 is not mathematical inadequacy or lack of ambition; it is the complete absence of causal attribution. When a manuscript presents an innovative multi-stage neural network that achieves state-of-the-art (SOTA) metrics on a public benchmark, reviewers immediately interrogate whether the measured improvement is truly driven by the theoretical contribution or merely reflects hyperparameter over-tuning, random seed cherry-picking, or hidden parameter inflation.
A typical fatal critique reads: 'The authors propose a hybrid attention-gated feature pyramid, but the experimental section fails to isolate the empirical contribution of the gating mechanism from the auxiliary loss function. Without a systematic ablation study and statistical variance testing across multiple random initializations, it is impossible to determine whether the reported 1.2% gain represents a genuine scientific advance or an artifact of stochastic optimization.' For doctoral researchers, confronting this critique during a 'Major Revision' or 'Reject & Resubmit' decision often triggers panic. Designing defensible ablation protocols and benchmarking frameworks from day one is the only reliable insurance against manuscript rejection.
Technical Takeaways
2. Deconstructing the True Ablation Study: Component Decoupling & Causal Attribution
The term 'ablation' originates in experimental neurobiology and surgical pathology, where researchers selectively excise specific brain structures or tissue tracts to observe the resulting functional deficits, thereby deducing the operational role of that localized tissue. In machine learning and deep neural engineering, an ablation study serves the exact same diagnostic function: it is the systematic, controlled removal, replacement, or deactivation of individual architectural components, loss terms, or data processing pipelines to measure the resulting degradation or alteration in model performance.
A rigorous ablation study is not a perfunctory table thrown together in the final week before paper submission. It is a structured scientific experiment based on the principle of single-variable isolation. To satisfy IEEE Transactions reviewers, scholars must categorize and execute ablations across four fundamental dimensions: Architectural Components, Loss Function Formulations, Data Augmentation Strategies, and Input Representation Dimensions.
Architectural component ablation requires systematically stripping non-essential elements. For instance, if your proposed architecture introduces a dual-branch cross-attention module with a residual gating mechanism and a spatial squeeze-and-excitation block, your ablation matrix must evaluate: (1) Backbone alone, (2) Backbone + Standard Attention, (3) Backbone + Cross-Attention without Gating, (4) Backbone + Cross-Attention with Gating (Proposed), and (5) Backbone + Gating without Cross-Attention. This combinatorial decoupling proves beyond doubt that every individual sub-module earns its keep in terms of compute overhead versus performance dividend.
Technical Takeaways
3. Hyperparameter Sensitivity & The Multi-Seed Variance Protocol
One of the most insidious flaws in doctoral AI manuscripts is the 'lucky seed' phenomenon. Deep learning models trained via stochastic gradient descent (SGD) or AdamW are notoriously sensitive to weight initialization, mini-batch shuffling, and hardware non-determinism (such as CUDA atomic operation race conditions). A model evaluated on a single seed may yield an impressive 94.2% Top-1 accuracy simply because that specific initialization navigated around bad local minima, while ten other random initializations would yield an average of only 91.5%.
Flagship Springer and IEEE journals now expect a rigorous multi-seed protocol. Every reported baseline and proposed architecture must be executed across a minimum of five to ten distinct random seeds (e.g., s in {42, 1337, 2024, 3407, 9999}). Rather than reporting a single scalar value in your primary results table, results must be presented in the standard format: Mean +/- Standard Deviation (e.g., 93.42 +/- 0.38%). If the standard deviation of your proposed model overlaps heavily with the standard deviation of the leading baseline, reviewers will immediately notice that your claimed performance superiority is statistically indistinguishable from background noise.
Furthermore, reviewers demand hyperparameter sensitivity analyses. If your novel loss formulation incorporates weighting coefficients lambda_1 and lambda_2, or if your spatial attention module relies on a scaling temperature tau, you must plot sensitivity curves demonstrating how performance behaves as these parameters vary across log-scale ranges. A robust model exhibits a wide, stable plateau (a 'basin of attraction'); a brittle model that collapses if lambda shifts from 0.05 to 0.07 will be rejected as an ungeneralizable artifact of excessive tuning.
Technical Takeaways
4. Curating SOTA Baselines: Avoiding the 'Strawman' Comparison Trap
Perhaps no mistake damages an author's credibility in the eyes of an associate editor faster than the 'strawman baseline' trap. In modern literature reviews, reviewers frequently encounter submissions from 2025 or 2026 claiming SOTA performance, yet their experimental comparisons exclusively benchmark against ResNet-50 (He et al., 2015), VGG-16 (Simonyan & Zisserman, 2014), or standard U-Net (Ronneberger et al., 2015). Comparing a newly designed 2026 architecture solely against decade-old foundational networks while ignoring the twenty papers published on the exact same task in IEEE Transactions over the preceding twenty-four months is a guaranteed recipe for immediate desk rejection.
To construct an unassailable benchmark suite, doctoral researchers must implement a Three-Tier Baseline Taxonomy. Tier 1 comprises canonical historical baselines that ground your work in foundational literature (e.g., standard ResNet or Vision Transformer). Tier 2 comprises the direct contemporary state-of-the-art—the top three to five highest-performing models published in Q1 journals or top-tier conferences (CVPR, ICCV, NeurIPS, ICML, ICLR) within the last 12 to 24 months. Tier 3 comprises architectural domain peers that share a similar parameter footprint or computational budget.
Equally critical is benchmark parity. You must never compare your proposed model, trained for 300 epochs with cosine annealing and CutMix data augmentation, against baseline models trained for 50 epochs with standard stochastic gradient descent without augmentation. All baselines must either be evaluated using their author-released official checkpoints on your standardized test split, or re-trained under strictly identical training regimes, epoch bounds, and optimization budgets. When reviewers see that you gave competitor baselines the exact same modern training advantages as your own model, their trust in your findings multiplies exponentially.
Technical Takeaways
5. Reporting Computational Efficiency: FLOPs, MACs, Latency, and Memory Footprint
In the contemporary computational research landscape, accuracy is only half the equation. With the pervasive deployment of deep neural networks onto edge devices, robotics, automotive hardware, and mobile micro-controllers, reviewers heavily scrutinize computational overhead. A proposed model that achieves a 0.8% accuracy gain over an existing baseline while incurring a 400% increase in floating-point operations (FLOPs) and doubling peak GPU memory consumption is not an engineering breakthrough—it is an inefficient computational burden.
IEEE and Springer reviewers expect a dual reporting structure that separates theoretical computational complexity from empirical hardware latency. Theoretical complexity must be quantified using Floating Point Operations (FLOPs), Multiply-Accumulate operations (MACs), and total trainable parameter count. These values reflect the algorithmic scaling behavior of your architecture independent of physical hardware.
Empirical complexity, on the other hand, measures physical real-world execution. You must report inference latency in milliseconds per sample (both for batch size = 1, simulating edge real-time inference, and batch size = 32, simulating cloud throughput), memory footprint (peak VRAM allocation during training and inference measured via 'torch.cuda.max_memory_allocated()'), and throughput (frames per second or tokens per second). Crucially, all latency benchmarks must be captured on the exact same physical GPU under identical thermal conditions, discarding the initial 100 warm-up iterations to eliminate CUDA context initialization spikes.
Technical Takeaways
6. Statistical Significance Testing: Moving Beyond Raw Metric Tables
One of the fastest-growing reasons for rejection in Q1 AI and computational journals is the presentation of marginal metric gains without formal statistical hypothesis testing. If your proposed model achieves an F1-score of 91.8% while the strongest baseline achieves 91.2%, how can a reviewer or peer reader be certain that this 0.6% delta is reproducible and statistically significant rather than a random artifact of test set sampling error? Without statistical validation, you cannot.
Doctoral researchers must master the statistical testing matrix appropriate for machine learning benchmarks. When comparing two algorithms evaluated across multiple independent folds or cross-validation splits, the standard Paired Student's t-Test may be applied only if the distribution of performance differences conforms to Gaussian normality (verified via Shapiro-Wilk or Kolmogorov-Smirnov tests). In the vast majority of real-world ML benchmarks where normality assumptions fail, the non-parametric Wilcoxon Signed-Rank Test is the gold standard demanded by IEEE Transactions.
When evaluating algorithms across multiple distinct benchmark datasets (for example, benchmarking your computer vision architecture across five different medical imaging datasets), reviewers expect the non-parametric Friedman Test followed by a post-hoc Nemenyi or Bonferroni-Dunn analysis. This allows you to construct a Critical Difference (CD) diagram, visually illustrating which algorithms perform within a statistically indistinguishable clique and demonstrating that your architecture achieves a statistically significant rank advantage over all peer baselines at alpha = 0.05 or alpha = 0.01.
Technical Takeaways
7. Constructing the Defensible Ablation Table & Visualizations for LaTeX Submissions
The visual and tabular formatting of your ablation study within your LaTeX manuscript directly influences how reviewers perceive your methodological maturity. Sloppy tables, ambiguous column headers, and confusing abbreviations trigger cognitive fatigue and invite hyper-critical scrutiny. High-tier IEEE and Springer submissions utilize clean, elegant tabular structures built with the LaTeX 'booktabs' package, completely avoiding vertical grid lines and relying strictly on '\toprule', '\midrule', and '\bottomrule'.
The most effective ablation table design is the Cumulative Component Toggle Matrix. In this format, each row represents an architectural iteration, and columns feature clean checkmarks ('\checkmark') and cross marks ('\ding{55}') indicating the active presence or omission of each proposed sub-module, followed by the resulting metrics (e.g., Accuracy, mIoU, FLOPs, Latency). This format allows reviewers to scan vertically down a column and immediately perceive the exact numerical consequence of introducing or removing that specific module.
Complementing your ablation tables with rich, high-interpretability visualizations elevates your manuscript above 90% of competing submissions. Include qualitative visual ablations, such as Grad-CAM, Grad-CAM++, or attention rollout heatmaps. Show side-by-side visual comparisons illustrating how attention heatmaps localize tightly onto critical pathological features or object contours when your proposed mechanism is active, compared to diffuse, unfocused attention spread across background noise when the module is ablated. Visual proof of representation refinement is impossible for a reviewer to dismiss.
Technical Takeaways
8. Responding to Reviewer #2: Battle-Tested Rebuttal Scripts for Common Methodology Attacks
Even when you execute a meticulous ablation study, peer reviewers in premier journals will inevitably probe for vulnerabilities. Surviving a rigorous peer review cascade requires mastering the art of the scientific rebuttal. The response to reviewers must be deferential yet scientifically unyielding, supporting every rebuttal statement with empirical tables, revised code artifacts, and concrete statistical proofs.
Consider the classic attack: 'The performance gain of the proposed method is marginal (< 1%), which does not warrant the added architectural complexity.' Rather than arguing defensively, your rebuttal must deploy a structured three-part response: First, provide a Wilcoxon signed-rank test demonstrating that despite the modest absolute percentage, the gain is statistically significant at p < 0.001 across all 10 evaluation seeds. Second, present a parameter efficiency ratio showing that your model achieves this gain while using 25% fewer parameters and 30% fewer FLOPs than the leading baseline. Third, contextualize the real-world domain significance: in medical diagnostics or autonomous vehicle trajectory prediction, a 0.8% reduction in false negatives translates to hundreds of lives protected in real-world clinical or edge deployments.
By approaching the methodology, benchmarking, ablation design, and peer-review rebuttal process as an integrated, rigorous engineering continuum, doctoral scholars and AI researchers can transform their submissions from vulnerable drafts into unrejectable scientific milestones that sail through IEEE Transactions and Springer peer review with confidence.