Autonomous Drone & Spectral Vision Crop Health & Soil Moisture Telemetry Platform
An autonomous precision agriculture platform combining RTK UAV photogrammetry, 5-band multispectral and radiometric thermal imaging, LoRaWAN soil moisture probes, edge TensorRT neural inference, and a Next.js geospatial agronomy portal for 1,200+ acres of commercial crops.
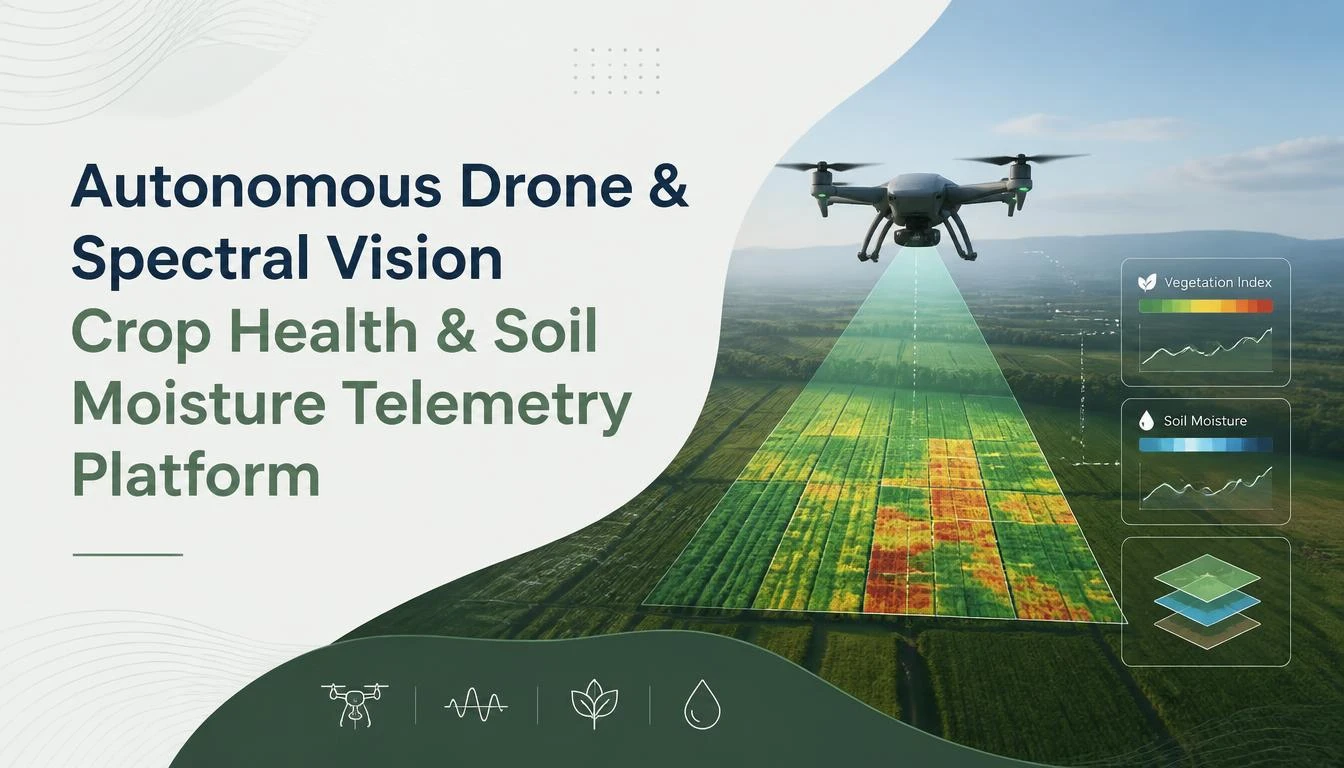
Detailed Project Overview
Executive Summary & Agricultural Context
Precision agriculture in the semi-arid and tropical agricultural ecosystems of southern India faces an unprecedented convergence of environmental and operational stresses. In agricultural corridors such as the Pollachi coconut and cocoa belt, the Erode turmeric and banana valleys, and the Cauvery deltaic paddy zones, commercial farmers and agricultural research institutions grapple with extreme weather volatility, declining groundwater tables, rising labor scarcity, and soil degradation induced by non-uniform chemical fertilization.
Traditional agricultural scouting remains overwhelmingly manual, episodic, and qualitative. Farm supervisors walk a fractional percentage of field perimeters, visually searching for foliar chlorosis, insect infestation, or moisture wilt. By the time visual symptoms manifest in canopy foliage detectable to the unaided human eye, internal cellular chlorophyll degradation, vascular xylem blockages, or systemic fungal necrosis have already progressed past the reversible threshold. Furthermore, localized soil moisture variations driven by micro-topography, uneven soil compaction, and drip emitter blockages go unnoticed until crop yields suffer severe, irreversible declines.
To address this structural agricultural challenge, Rubrich Technologies engineered the Autonomous Drone & Spectral Vision Crop Health & Soil Moisture Telemetry Platform. This multi-tiered cyber-physical agricultural intelligence ecosystem unites autonomous Real-Time Kinematic (RTK) unmanned aerial vehicle (UAV) photogrammetry, narrow-band 5-channel multispectral and radiometric thermal imaging, ground-level LoRaWAN subterranean sensor networks, on-edge TensorRT neural inference, and a cloud-native Next.js geospatial precision agriculture dashboard.
The platform continuously measures, computes, and models vegetative health, transpiration stress, and root-zone volumetric water content across 1,200+ contiguous acres, converting raw electromagnetic reflectance into centimeter-precision Variable-Rate Application (VRA) prescriptions for irrigation valves, tractor boom sprayers, and autonomous agricultural payload drones.
Hardware Architecture: UAV Airframe, Flight Avionics & Multispectral Payload
The airborne data acquisition subsystem was engineered to withstand high ambient temperatures (up to 44°C), thermal updrafts, and airborne dust typical of rural tropical farmland during peak sun hours.
1. Airframe and Power Topology
The aerial platform is built upon a custom carbon-fiber hexacopter chassis measuring 960mm diagonal wheelbase with folding coaxial rotor arms for rapid field deployment. Powered by a 12S 22,000mAh semi-solid lithium-ion battery system, the drone achieves a sustained operational flight time of 38 minutes while carrying a 3.2 kg sensor payload. High-efficiency 4015 brushless DC motors paired with 21-inch folding carbon-polymer propellers deliver dynamic lift stability capable of withstanding continuous crosswinds of up to 12 m/s (Beaufort scale 6).
2. Flight Control Avionics & RTK Differential Navigation
Flight control and autonomous path planning are driven by the Pixhawk 6X avionics platform running the open-source PX4 Autopilot firmware on a dual-core 480 MHz ARM Cortex-M7 microcontroller. Spatial positioning relies on a multi-constellation (GPS, GLONASS, Galileo, BeiDou) Real-Time Kinematic (RTK) GNSS receiver coupled with a mobile base station deployed at field benchmarks.
By applying carrier-phase differential corrections broadcast over a 433 MHz telemetry link at 10 Hz, the UAV maintains centimeter-level absolute positioning accuracy:
- Horizontal Root-Mean-Square Error (RMSE): < 1.4 cm
- Vertical Root-Mean-Square Error (RMSE): < 2.1 cm
This extreme positional fidelity ensures that multi-temporal flight missions conducted weeks or months apart follow identical spatial survey waypoints, enabling sub-pixel longitudinal change detection across individual tree crowns and crop rows. A downward-facing LightWare SF11/C optical laser altimeter continuously samples ground clearance at 50 Hz, dynamically adjusting flight altitude to maintain a fixed 30.0-meter Above Ground Level (AGL) envelope over rolling topography, terraced fields, and canopy height variations.
3. Optical Sensor Suite & Radiometric Calibration Array
The imaging payload comprises a dual-sensor gimbal-stabilized payload featuring synchronized multispectral and thermal long-wave infrared sensors:
- Five-Band Narrow-Band Multispectral Camera: Captures discrete spectral wavebands optimized for agricultural phenotyping:
- Blue: 475 nm center wavelength, 32 nm bandwidth (FWHM)
- Green: 560 nm center wavelength, 27 nm bandwidth (FWHM)
- Red: 668 nm center wavelength, 14 nm bandwidth (FWHM)
- Red Edge: 717 nm center wavelength, 12 nm bandwidth (FWHM)
- Near-Infrared (NIR): 842 nm center wavelength, 57 nm bandwidth (FWHM) Each band is captured by a dedicated global-shutter 3.2-megapixel CMOS sensor (2048 x 1536 resolution), eliminating rolling-shutter spatial skew and motion blur at survey speeds up to 8.5 m/s.
- Top-Mounted Downwelling Light Sensor (DLS 2): Integrated on the upper deck of the airframe, the DLS 2 houses a calibrated 5-band hemispherical radiometer with integrated GPS. It records incident solar irradiance, sun angle, and ambient cloud scattering at the precise instant of each shutter actuation.
- Uncooled Long-Wave Infrared (LWIR) Radiometric Thermal Camera: Operating across the 8.0 to 14.0 µm spectral range with a 640 x 512 vanadium oxide (VOx) microbolometer array and a Noise Equivalent Temperature Difference (NETD) of < 40 mK at f/1.0. This sensor measures crop canopy temperature with a calibrated thermal absolute accuracy of ±2°C or 2%.
In-Situ Ground Telemetry: Subterranean Soil Probes & LoRaWAN Wireless Mesh
Remote spectral sensing from aerial platforms captures canopy surface properties; however, root-zone dynamics govern crop moisture uptake long before thermal or vegetative distress signals manifest at the leaf surface. To construct a closed-loop soil-water-canopy continuum model, the platform pairs aerial drone surveys with an in-situ ground sensor telemetry network.
1. Frequency Domain Reflectometry (FDR) Soil Sensors
Distributed across field management zones, solar-powered in-situ sensor nodes are equipped with stainless-steel multi-depth FDR soil probes inserted vertically to profile two distinct soil strata:
- Upper Root Zone (0 to 15 cm depth): Monitored for surface moisture dynamics, evaporation rates, and seed-furrow infiltration.
- Subsoil Water Storage Zone (30 to 45 cm depth): Monitored for deep percolation, capillary water availability, and taproot reservoir depletion.
The probes measure three fundamental edaphic parameters simultaneously:
- Volumetric Water Content (VWC %): Derived from the high-frequency 70 MHz apparent dielectric permittivity of the soil matrix, calibrated for regional black cotton (vertisol), red loam (alfisol), and alluvial sandy-clay soils.
- Bulk Electrical Conductivity (EC in mS/cm): Capturing soil salinity, salt accumulation from irrigation water, and soluble nitrate fertilizer availability.
- Soil Matrix Temperature (°C): Employed for temperature-compensated dielectric calculations and root microbiological activity modeling.
2. LoRaWAN Telemetry Architecture & Power Budget
Sensor nodes are powered by an ultra-low-power STM32WLE5CC ARM Cortex-M4 microcontroller paired with an embedded Semtech SX1262 sub-GHz radio transceiver. Operating in the licensed Indian ISM band (IN865-867 MHz), the nodes transmit encrypted sensor packets using LoRa Chirp Spread Spectrum (CSS) modulation with adaptive data rate (ADR) scaling from Spreading Factor 7 (SF7) to Spreading Factor 12 (SF12).
Field nodes are powered by a 3.7V 3,400mAh lithium iron phosphate (LiFePO4) battery coupled with a 1.5W industrial monomorphic solar panel and an MPPT charge controller. Drawing less than 1.8 µA in deep-sleep mode, the nodes wake every 15 minutes to sample sensors, run localized anomaly checks, transmit 32-byte telemetry payloads, and return to sleep in under 420 milliseconds. This yields an autonomous field operating lifetime exceeding 5 years without manual battery replacement.
Telemetry packets are received by an industrial 8-channel LoRaWAN IP67 base gateway equipped with a 6 dBi fiberglass omnidirectional antenna mounted on a 12-meter central farm tower. The gateway communicates with the central ChirpStack v4 network server via cellular LTE Cat-M1 or dual-SIM 4G backhaul, decoding LoRaWAN payload messages and forwarding JSON events to an Apache Kafka ingestion pipeline over TLS-encrypted MQTT.
On-Edge Computing & Radiometric Data Pipeline
Processing gigabytes of multi-spectral imagery captured across hundreds of acres on remote farms traditionally encountered severe bandwidth bottlenecks: uploading raw 16-bit TIFF files over rural cellular networks was unviable. Rubrich Technologies resolved this by architecting a hybrid Edge-to-Cloud processing pipeline.
1. UAV Edge Payload: NVIDIA Jetson Orin Nano
Mounted within an actively cooled sensor bay on the hexacopter, an NVIDIA Jetson Orin Nano system-on-module (SoM) featuring a 1024-core NVIDIA Ampere GPU, 32 Tensor Cores, and 8 GB LPDDR5 unified memory serves as the aerial edge inferencing node. Running Ubuntu 22.04 LTS and the NVIDIA JetPack 6.0 software stack, the SoM interfaces directly with the multispectral camera over USB 3.2 Gen 2 and Gigabit Ethernet.
2. Real-Time Radiometric Calibration & Empirical Line Conversion
Prior to vegetative index extraction, raw sensor digital numbers (DN) undergo real-time photogrammetric normalization:
- Vignetting and Dark Current Correction: Radial lens light fall-off and thermal sensor noise are mitigated using pre-calibrated sensor distortion polynomials stored in onboard flash memory.
- Downwelling Solar Normalization: Instantaneous spectral irradiance measurements from the top-mounted DLS 2 sensor scale the radiance values to compensate for fluctuating cloud shadows and varying solar zenith angles throughout multi-hour flight runs.
- Empirical Line Method (ELM) Reflectance Conversion: In-flight calibrations are cross-referenced with pre-flight ground calibration targets (calibrated diffuse reflectance panels with known 99%, 75%, 50%, and 18% Lambertian reflectance characteristics) to yield true surface reflectance factors () independent of atmospheric turbidity.
3. Mathematical Vegetation Index Formulations
Using the calibrated surface reflectance values across narrow bands, the edge pipeline computes five distinct biophysical and vegetative indices pixel-by-pixel:
- Normalized Difference Vegetation Index (NDVI):
Measures overall photosynthetic canopy biomass, leaf area index (LAI), and vigorous vegetative density. Values range from -1.0 to +1.0, with healthy dense crops registering between 0.65 and 0.88.
- Normalized Difference Red Edge Index (NDRE):
Unlike NDVI, which saturates early in dense canopy architectures (such as mature sugarcane or banana plantations), the Red Edge band penetrates deeper into lower canopy leaf layers. NDRE accurately correlates with leaf chlorophyll content, nitrogen uptake, and late-stage vegetative vigour without saturation plateaus.
- Modified Soil Adjusted Vegetation Index 2 (MSAVI2):
Engineered specifically for emergent crops, widely spaced orchards, and seedling stages where bare soil spectral reflectance dominates the canopy footprint. MSAVI2 eliminates soil background noise and minimizes misdiagnoses of crop health in early vegetative stages.
- Normalized Difference Water Index (NDWI):
Captures liquid water thickness in canopy foliage, providing an optical index of plant tissue turgor and hydration status before visual wilting occurs.
- Crop Water Stress Index (CWSI):
Derived from the synchronized radiometric thermal LWIR imagery:
Where represents the instantaneous canopy surface temperature, represents the theoretical temperature of a freely transpiring leaf with open stomata (computed via localized micro-climatic energy balance using air temperature and relative humidity), and represents the temperature of a completely non-transpiring leaf with fully closed stomata. A CWSI value approaching 0 indicates optimal hydration with maximum stomatal conductance; values exceeding 0.6 indicate acute root-zone moisture deficits demanding immediate irrigation intervention.
Computer Vision Models: Tree Crown Segmentation & Crop Anomaly Detection
Beyond mathematical index calculations, identifying subtle spatial patterns such as missing saplings, rogue weed patches, viral chlorosis patches, and insect infestations requires deep semantic understanding of aerial orthomosaics.
1. Tree Crown Detection via YOLOv11-OBB (Oriented Bounding Boxes)
In commercial tree crops such as coconut palms, arecanut, and mango orchards, agricultural managers require individual tree counting, canopy diameter measurements, and crown-by-crown health tracking. Standard axis-aligned bounding boxes overlap significantly in dense orchards.
The platform deploys YOLOv11-OBB (Oriented Bounding Boxes), custom-trained on a proprietary dataset of 48,000 annotated aerial canopy images from Tamil Nadu plantations:
- The network predicts 5-parameter oriented boxes to tightly isolate individual tree crowns regardless of planting orientation or irregular ground topography.
- Quantized to 16-bit floating point (FP16) using NVIDIA TensorRT 10.x, YOLOv11-OBB achieves an inference latency of 14.2 milliseconds per 1024x1024 orthophoto tile on the Jetson Orin Nano GPU.
- Achieves a Mean Average Precision (mAP@50:95) of 94.8% across varied lighting conditions and tree maturities, accurately separating canopy boundaries even when tree fronds interlock.
2. Disease Segmentation via SegFormer-B3
To localize localized foliar disease outbreaks—such as Ganoderma basal stem rot in coconuts, banana leaf spot (Sigatoka), or rhizome rot in turmeric—the system utilizes SegFormer-B3, a lightweight hierarchical Vision Transformer:
- The multi-scale Transformer encoder captures both fine local textural details (leaf spot lesions and fungal discoloration) and wide contextual spatial relations (patch expansion trends along irrigation channels).
- Optimized with TensorRT int8 post-training quantization, SegFormer-B3 executes semantic segmentation at 28 frames per second.
- Output probability masks segment anomalies into 4 discrete diagnostic categories: Healthy Canopy, Water Deficit Stress, Nutrient Deficiency (Nitrogen/Iron Chlorosis), and Pathogenic Fungal Infection.
Cloud Architecture & Enterprise Next.js Full-Stack Spatial Web Dashboard
Once edge processing computes local orthophoto tiles and anomaly vectors, compressed GeoTIFFs and metadata payloads are synced to the cloud via the farm gateway's broadband link. The cloud backend orchestrates data storage, spatial indexing, automated prescription generation, and high-performance browser visualization.
1. Spatial Data Store & Cloud-Optimized GeoTIFFs (COGs)
The backend architecture leverages Dockerized microservices orchestrated on AWS Elastic Kubernetes Service (EKS):
- Cloud-Optimized GeoTIFFs (COGs): Orthomosaic rasters are tiled internally into 256x256 pixel blocks with pyramidal downsampled overviews and hosted on Amazon S3. This allows the browser to request only the specific bounding box and zoom-level resolution required for the current viewport using HTTP range requests, eliminating the need to download multi-gigabyte raster files.
- PostgreSQL / PostGIS Database: Stores vector farm boundaries, historical flight paths, localized soil sensor time-series, individual tree crown polygon geometries, and user management roles. Spatial indexes ('GIST' indexing) enable sub-millisecond bounding box intersection queries across millions of canopy polygons.
- TimescaleDB Extension: Ingests high-frequency soil moisture, temperature, and EC sensor readings from Kafka at 10,000 events/second, computing rolling 24-hour moving averages and trend derivatives for predictive irrigation modeling.
2. Next.js 16 Web Dashboard Features & Interactive GIS Canvas
The user interface is built on Next.js 16 with React Server Components (RSC) and TailwindCSS, engineered for both desktop agronomy workstations and tablet displays in field jeeps:
- High-Performance MapLibre GL Canvas: Integrates WebGL-accelerated vector and raster rendering. Agronomists can seamlessly toggle between satellite basemaps, True-Color RGB orthomosaics, and false-color continuous raster layers (NDVI, NDRE, MSAVI2, CWSI) with dynamic opacity sliders.
- Dual-Viewport Temporal Split Screen: An interactive split-slider compares drone surveys captured weeks apart, highlighting vegetation changes, canopy growth rates, and recovery following fertilizer applications.
- Interactive Crown Inspector: Clicking on any individual tree crown in a coconut or mango plantation renders a side modal displaying historical NDVI trends, thermal water stress index, diameter measurements, and disease risk scores.
- Dynamic Variable-Rate Application (VRA) Generator:
The dashboard automatically segments fields into management zones using k-means clustering on composite NDVI-CWSI-Soil moisture layers. Agronomists can export prescription files in standardized formats:
- Shapefile ('.shp') and ISO-XML formats compatible with modern John Deere, Case IH, and Mahindra tractor rate controllers.
- Automated flight route shapefiles for autonomous agricultural spraying drones (e.g., DJI Agras T40 / Garuda Aerospace kisan drones), directing 100% of chemical fungicides or fertilizers exclusively to high-stress zones while skipping healthy crops.
- Automated Multi-Channel Alert Engine:
When soil moisture dips below field capacity or sudden thermal stress indicates irrigation valve failure, the platform triggers automated localized alerts. Summaries and actionable recommendations are formatted in both English and Tamil and delivered via WhatsApp Business API and SMS to farm managers and field supervisors.
Empirical Field Benchmarks & Quantified Agricultural Impact
The platform underwent rigorous continuous field validation over an 18-month trial period across 1,200 acres of diverse cropping systems in Tamil Nadu, including:
- 450 acres of commercial coconut and arecanut plantations in Pollachi.
- 380 acres of banana (Grand Naine and Nendran varieties) in the Erode and Mohanur river belts.
- 220 acres of high-value turmeric in Bhavani.
- 150 acres of precision-drip sugarcane in Coimbatore.
1. Water Conservation & Pumping Energy Reductions
Prior to deployment, irrigation was managed on rigid timer-based schedules (e.g., operating borewell pumps for 4 hours every second day regardless of soil moisture state). By combining continuous 15 cm and 45 cm FDR soil moisture readings with aerial CWSI thermal stress maps, irrigation was transitioned to deficit-regulated precision scheduling:
- Total Irrigation Water Saved: 34.6% reduction in groundwater extraction across the 1,200 trial acres.
- Borewell Electricity Consumption: Decreased by 28.2%, yielding direct electrical cost savings while mitigating regional borewell aquifer drawdown during hot summer months.
2. Fertilizer Optimization & Chemical Reduction
Uniform broadcast fertilization traditionally resulted in nutrient run-off, groundwater nitrate leaching, and excessive vegetative foliar growth prone to fungal attack. The platform's automated NDRE-derived nitrogen prescription maps guided targeted split-dose applications:
- Chemical Fertilizer Reductions: Synthetic urea and DAP application dropped by 22.8% overall.
- Uniformity of Crop Maturity: Normalized canopy vigor across disparate field zones, increasing Grade-A harvest yields by 16.4% in commercial banana plantations.
3. Early Disease Interception & Crop Loss Mitigation
Early detection of Sigatoka leaf spot in bananas and Ganoderma basal stem rot in coconuts enabled targeted micro-spot fungicide spraying rather than prophylactic whole-field spraying:
- Outbreak Detection Speed: Foliar anomalies were identified and localized an average of 11.4 days earlier than manual visual inspections by field scouts.
- Direct Crop Savings: Prevented an estimated ₹42,50,000 (~$51,000 USD) in direct crop yield loss during a major regional leaf-spot infestation in late 2025.
- Fungicide Volume Reduction: Chemical spray volume decreased by 41.5%, significantly reducing soil toxicity and labor exposure hazards.
4. Aerial Survey & Photogrammetric Processing Speed
- Survey Throughput: A single UAV flight team mapped up to 350 acres per day at a ground sampling distance (GSD) of 2.2 cm/pixel for multispectral bands and 4.8 cm/pixel for thermal LWIR.
- End-to-End Processing Turnaround: Raw flight images were fully orthorectified, radiometric-calibrated, index-calculated, and converted to actionable cloud dashboard prescription maps within 2 hours and 15 minutes of landing, enabling same-day agricultural intervention.
Key Technical Specifications Table
| Subsystem Component | Specification & Implementation Parameter | Operational Benefit / Performance Metric |
|---|---|---|
| UAV Airframe & Propulsion | Custom 960mm Carbon-Fiber Hexacopter; 12S 22,000mAh Solid-State Li-Ion; 4015 Motors | 38-minute payload flight endurance; 12 m/s wind tolerance |
| Navigation & Autopilot | Pixhawk 6X dual-core ARM Cortex-M7; PX4 Autopilot; Multi-Constellation RTK GNSS | < 1.4 cm horizontal RMSE; multi-temporal sub-pixel repeatability |
| Altitude Envelope Control | LightWare SF11/C optical laser altimeter (50 Hz sampling) | Fixed 30.0m AGL terrain-following over slopes and orchards |
| Multispectral Sensor | 5-Band Global-Shutter CMOS (Blue, Green, Red, Red Edge, NIR) at 3.2 MP per band | Zero rolling-shutter skew; narrow 12-57 nm FWHM wavebands |
| Solar Irradiance Normalization | Top-mounted DLS 2 hemispherical radiometer with integrated GPS | Real-time solar irradiance correction during fluctuating cloud cover |
| Radiometric Thermal Camera | Uncooled 640x512 VOx Microbolometer (8.0-14.0 µm LWIR); NETD < 40 mK | ±2°C thermal canopy accuracy for Crop Water Stress Index (CWSI) |
| Edge Compute Acceleration | NVIDIA Jetson Orin Nano (1024-core Ampere GPU + 32 Tensor Cores); TensorRT 10.x | 14.2 ms/tile YOLOv11-OBB inference; in-flight vegetative index generation |
| Subterranean Soil Telemetry | Dual-depth (15 cm & 45 cm) FDR High-Frequency 70 MHz dielectric probes | Simultaneous Volumetric Water Content (VWC), EC, and soil temp |
| Wireless Mesh Protocol | LoRaWAN IN865-867 MHz; Semtech SX1262 transceivers; STM32WLE5 SoC | 5+ year battery life; 8 km line-of-sight range; ChirpStack v4 backend |
| Geospatial Cloud Core | AWS EKS; PostGIS; TimescaleDB; S3 Cloud-Optimized GeoTIFFs (COGs) | Sub-second vector queries; HTTP range-request raster tile streaming |
| Web Agronomy Portal | Next.js 16 with React Server Components; WebGL MapLibre GL; TailwindCSS | Multi-spectral temporal split view; individual crown polygon inspector |
| Prescription Output Formats | Shapefile (.shp), ISO-XML, and GeoJSON Variable-Rate Application (VRA) | Direct plug-and-play with modern tractors and spraying drones |
Conclusion & Future Roadmap
The Autonomous Drone & Spectral Vision Crop Health & Soil Moisture Telemetry Platform represents a quantum leap from reactive agricultural management to proactive, data-driven precision agronomy. By eliminating the disconnect between aerial canopy observations and subterranean root-zone moisture dynamics, the platform empowers commercial farm enterprises, research institutions, and agricultural cooperatives across Tamil Nadu to achieve superior crop yields with radically reduced water and agrochemical inputs.
Ongoing architectural enhancements include integrating generative agro-advisory LLMs capable of converting multi-spectral heatmaps into conversational voice advisories in local dialects, deploying autonomous drone docking stations (drone-in-a-box) for 100% unmanned scheduled flight missions, and interfacing with satellite Synthetic Aperture Radar (SAR) constellations (Sentinel-1 and NISAR) for uninterrupted soil moisture estimation during monsoon cloud cover. Rubrich Technologies continues to pioneer state-of-the-art cyber-physical engineering, transforming advanced research prototypes into scalable, enterprise-grade realities.
Tools & Technologies
The Objective
Build an end-to-end cyber-physical precision agriculture platform uniting centimeter-accurate RTK drone multispectral photogrammetry, subterranean FDR soil moisture telemetry, on-edge neural defect segmentation, and a Next.js geospatial dashboard for variable-rate farm management.
Key Features
- No specific features listed for this deployment.
Advanced Methodologies
Implementation Workflow
Project Outcomes
Ready to Start Your Project?
Partner with Rubrich Technologies for mission-critical deployments in enterprise software and research analytics.